Refer to Figure a. If ? (the probability of state S) decreases, the x-intercept for the solid constant expected consumption line:
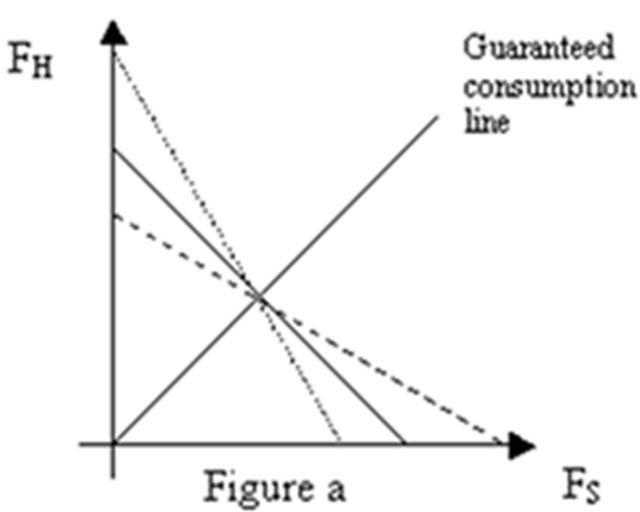
A. increases.
B. decreases.
C. does not change.
D. The answer cannot be determined without more information.
A. increases.
You might also like to view...
The data in the table above are the U.S. balance of payments. What is the current account balance?
A) $0 B) $150 billion C) -$100 billion D) -$150 billion
The demand curve shows the relationship between quantity demanded and
A) income. B) price. C) supply. D) quantity supplied.
In the long run when a perfectly competitive firm experiences positive economic profits
A. firms exit the industry, the market supply curve shifts leftward, and the market price rises. B. firms enter the industry, the market supply curve shifts rightward, and the market price falls. C. firms exit the industry, the market supply curve shifts rightward, and the market price falls. D. firms enter the industry, the market supply curve shifts rightward, and the market price rises.
The slippage between output and the unemployment rate occurs because the unemployment rate is calculated from data on
A. the number of people employed. B. the number of jobs. C. the number of people who do not want to work. D. the civilian adult population.