Use the given information to answer the question.The population of rabbits varies with the season due to migration, birth and death. The number, N, of rabbits during month x on a certain midwestern farm can be estimated with the following graph, where  corresponds to January, x = 2 corresponds to February, and so on.
  How many rabbits left the area or died between September and October?
A. 119 rabbits
B. 14 rabbits
C. 28 rabbits
D. 23 rabbits
Answer: D
Mathematics
You might also like to view...
Evaluate the integral.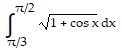
A. 2 - 
B. 1
C. 2 + 
D. 2
Mathematics
Find the requested term in the sequence.The nth term in 15, 30, 45, 60, 75, . . .
A. 15n + 2 B. 15n C. 15n + 15 D. 15n - 15
Mathematics
Find the missing angle.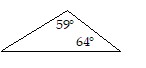
A. 49° B. 67° C. 57° D. 31°
Mathematics
Decide whether the function is an exponential growth or exponential decay function and find the constant percentage rate of growth or decay.f(x) = 20,060 ? 0.865x
A. Exponential growth function; -13.5% B. Exponential growth function; 0.135% C. Exponential decay function; 0.135% D. Exponential decay function; -13.5%
Mathematics