Figure 10-1
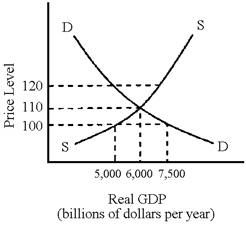
In Figure 10-1, what is the equilibrium level of real GDP and equilibrium price?
a.
$6,000 billion real GDP and price level of 110
b.
$5,000 billion real GDP and price level of 120
c.
$5,000 billion real GDP and price level of 110
d.
$7,500 billion real GDP and price level of 100
a
You might also like to view...
Your textbook plots the estimated regression function produced by the probit regression of deny on P/I ratio The estimated probit regression function has a stretched "S" shape given that the coefficient on the P/I ratio is positive. Consider a probit regression function with a negative coefficient. The shape would
A) resemble an inverted "S" shape (for low values of X, the predicted probability of Y would approach 1) B) not exist since probabilities cannot be negative C) remain the "S" shape as with a positive slope coefficient D) would have to be estimated with a logit function
Which of the following is TRUE about firms organized along functional lines?
a. Workers find it difficult to develop functional expertise b. Workers can easily share information within their division c. They inhibit the exploitation of economies of scale d. All of the above
Which of the following is not a leading economic indicator?
a. Prices of common stock b. Number of new businesses formed c. Unemployment rate d. New orders for plants and equipment
For profit-maximizing, competitive firms, the demand curve for each factor of production equals the value of the marginal product of that factor
a. True b. False Indicate whether the statement is true or false