Refer to the diagram. If line (c) represents the distribution of income before taxes and transfers and line (b) represents the distribution after taxes and transfers, then taxes and transfers have:
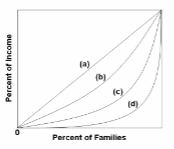
A. added to income inequality.
B. decreased the Gini ratio.
C. increased poverty.
D. reduced real GDP per person.
B. decreased the Gini ratio.
You might also like to view...
A ____ is a graph whose axes show the quantities of two inputs that are used to produce some output.
A. production indifference map B. two-variable diagram C. scalar diagram D. time-series graph
General Equilibrium assumptions are the same assumptions we used in a ___________________
Fill in the blank(s) with the appropriate word(s).
Which of the following is a monetary policy action to eliminate a recession?
A. A decrease in the marginal tax rate. B. The sale of securities in the open market by the Fed. C. A decrease in the discount rate. D. Increased investment in job training programs.
If a firm wants to maximize profits, it should hire workers up to the point at which
A) total factor cost = total revenue. B) marginal factor cost = marginal revenue product. C) marginal utility = marginal cost. D) total social benefit = total social costs.