The figure above shows the marginal social cost curve of generating electricity and the marginal private cost curve. The marginal cost borne by producers when 200 billion kilowatt hours are produced is
A) 0¢ per kilowatt.
B) 10¢ per kilowatt.
C) 20¢ per kilowatt.
D) 15¢ per kilowatt.
E) 5¢ per kilowatt.
B
You might also like to view...
Refer to the figure below. In response to gradually falling inflation, this economy will eventually move from its short-run equilibrium to its long-run equilibrium. Graphically, this would be seen as 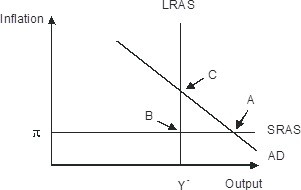
A. long-run aggregate supply shifting leftward B. Short-run aggregate supply shifting upward C. Short-run aggregate supply shifting downward D. Aggregate demand shifting leftward
A game in which any gains within the group are exactly offset by equal losses by the end of the game is a
A) positive-sum game. B) zero-sum game. C) strategy. D) negative-sum game.
Between 1999 and 2015, throughout the world more children attended school:
A. only in those countries with strong economic growth. B. only in those countries with free college education. C. even in countries that did not experience strong economic growth. D. which contributed to the drop in family cohesiveness in developing countries.
In making comparisons of personal income among countries, care must be exercised because in poor countries much of what is produced does not pass through markets and thus does not get counted in the nation's income.
Answer the following statement true (T) or false (F)