Use the graph of the function f(x) to locate the local extrema and identify the intervals where the function is concave up and concave down.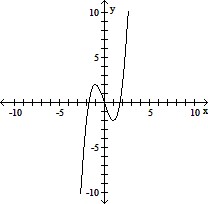
A. Local minimum at x = 1; local maximum at x =-1; concave down on (0, ?); concave up on (-?, 0)
B. Local maximum at x = 1; local minimum at x =-1; concave up on (0, ?); concave down on (-?, 0)
C. Local minimum at x = 1; local maximum at x =-1; concave up on (0, ?); concave down on (-?, 0)
D. Local maximum at x = 1; local minimum at x =-1; concave up on (-?, ?)
Answer: C
You might also like to view...
Find the Taylor polynomial of order 3 generated by f at a.f(x) = ln(x + 1), a = 4
A. ln 3 -  +
+  -
- 
B. ln 5 -  +
+  -
- 
C. ln 5 +  -
-  +
+ 
D. ln +  +
+  +
+ 
Solve using the addition principle.6.9 = 17.5 - t
A. -24.4 B. -10.6 C. 10.6 D. 24.4
Provide the proper response.Explain why  and -
and -  represent the same number.
What will be an ideal response?
Use graphs to find the set.(-?, 5) ? [-9, 14)
A. (-?, -9] B. [-9, 5) C. (5, 14) D. (-?, 14)