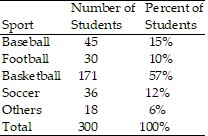
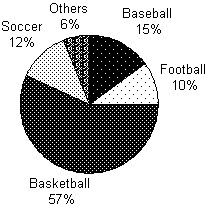
Complete the table by listing the percent of the whole for each category. Then place the percent data in the circle graph.The table shows the favorite sports for 300 students.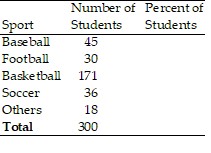

What will be an ideal response?
Mathematics
You might also like to view...
Decide if the given values of x are solutions to the equation (Y/N). ? 13; x = 6, x = - 8
A. Yes, Yes B. Yes, No C. No, No D. No, Yes
Mathematics
Solve the problem.How many triangles (of any size) are there in the figure?
A. 19 B. 13 C. 15 D. 16
Mathematics
Solve the inequality and give the solution set.|x - 1| ? 0
A. {-1} B. {0} C. {1} D. {t|-1 ? x ? 1}
Mathematics
Perform the indicated operations.( 5x2 - 2x - x3 + 5) - ( 8x2 - 2x - x3 + 4)
A. -4x2 - 9 B. -3x2 + 1 C. -3x2 - 4x - 9 D. -4x2 - 2x3 - 1
Mathematics