The comparative bar graph below shows the number of male and female athletes at a university over a four-year period. Use the comparative bar graph to answer the question.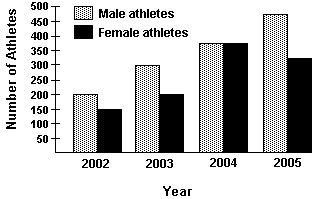 Which year had the same number of male and female athletes?
A. 2005
B. 2003
C. 2002
D. 2004
Answer: D
Mathematics
You might also like to view...
Find the Jacobian  or
or  (as appropriate) using the given equations.


A. 32
B. - 
C. -45
D. 
Mathematics
Solve the problem.Find the point on the line  that is closest to the origin.
A. 
B. 
C. 
D. 
Mathematics
Solve the system of equations.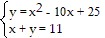
A. (5, 6) B. (7, 4), (2, 9) C. (7, 18), (2, 9) D. (-7, 18), (-2, 13)
Mathematics
Choose the most reasonable metric length unit. Choose from km, m, cm, and mm.The height of the paperback book is 23  .
.
A. m B. cm C. mm D. km
Mathematics