List the intercepts of the graph. 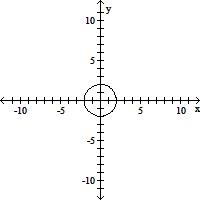
A. (-2, 0), (0, -2), (0, 0), (0, 2), (2, 0)
B. (0, 2), (2, 0)
C. (-2, 0), (0, -2), (0, 2), (2, 0)
D. (-2, 0), (0, 2)
Answer: C
You might also like to view...
Use a graphing calculator to find the range of the function.y = 
A. All real numbers y > 0 B. All real numbers except y = 6 C. All real numbers except y = 4 D. All real numbers except y = 0
Solve the problem.The population of a particular city is increasing at a rate proportional to its size. It follows the function  where k is a constant and t is the time in years. If the current population is 40,000, in how many years is the population expected to be 100,000? (Round to the nearest year.)
A. 3 yr B. 8 yr C. 59 yr D. 5 yr
Find the product.(x + 3)3
A. x3 + 9x2 + 27x + 27 B. x3 + 9x2 + 9x + 27 C. x3 + 9x2 + 3x + 27 D. x3 + 3x2 + 3x + 27
Solve the problem.An approximation of the amount in billions of dollars that Americans have spent on their pets from 1998 to 2006 can be obtained by substituting a given year for x in the expression 1.712x - 3402. How has the amount Americans have spent on their pets changed from 1998 to 2006?
A. It has largely increased. B. It has increased a little. C. It does not really change. D. It has decreased.