Figure 11-2
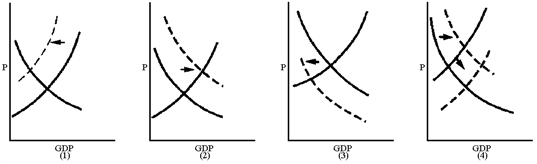
Which graph in Figure 11-2 best reflects a Keynesian's view of the short-run impact of an increase in the personal income tax rate?
a.
1
b.
2
c.
3
d.
4
c
You might also like to view...
If a firm that has variable costs of $8 million shuts down, we may conclude that its total revenue is __________.
Fill in the blank(s) with the appropriate word(s).
Explain why a firm maximizes its total profits by producing where MC = MR. To answer this question completely, you should explain why output levels greater than and less than the level where MC = MR do not maximize profits.
What will be an ideal response?
To determine whether a particular good is a normal good, a luxury good, or an inferior good, you would want to observe what happens to demand for the good when __________ changes.
A. supply B. the price of raw materials C. price D. income
If the price of a good increases by 5% and the quantity demanded decreases by 5%, then at that price, the good is
A. perfectly inelastic. B. unit elastic. C. elastic. D. inelastic.