The following double bar graph represents the number of students enrolled in the Welding and Machine Technology programs at a community college. Use the chart to answer the following question(s).
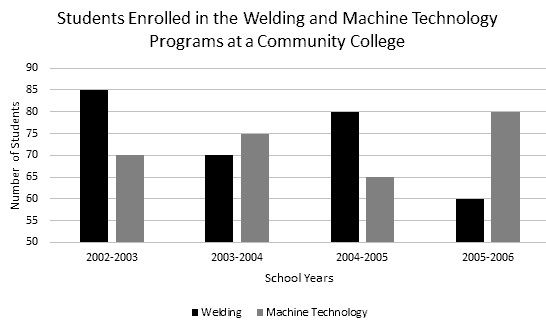 Which year saw the highest enrollment in the Welding program, and which year saw the lowest enrollment?
A. 2003-2004 and 2004-2005
B. 2004-2005 and 2005-2006
C. 2002-2003 and 2005-2006
D. 2002-2003 and 2003-2004
Answer: C
You might also like to view...
Use the graph to evaluate the limit. f(x)
f(x)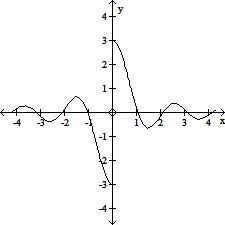
A. -3 B. does not exist C. 0 D. 3
Calculate the slope of the line passing through the given points. If the slope is undefined, so state. Then indicate whether the line rises, falls, is horizontal, or is vertical.(7, 1), (-7, -6)
A. - 6, falls
B.  , rises
C. -  , falls
D. 2, rises
Find the eigenvalues and the corresponding eigenvectors 
What will be an ideal response?
Solve the problem. Express your answer in scientific notation, rounding as needed.A computer can do one calculation in 1.4 × 10⁻⁷ seconds. How long would it take the computer to do a trillion (1012) calculations?
A. 1.4 × 10⁻⁷ sec B. 1.4 × 10⁶ sec C. 1.4 × 10¹² sec D. 1.4 × 10⁵ sec