The figure above shows the market for coffee. If the government pays the coffee producers a subsidy and production increases to 30 million pounds per day, the market is
A) efficient because the marginal social benefit from the last pound of coffee exceeds its marginal social cost.
B) efficient because the total social benefit from coffee exceed the total social cost.
C) inefficient because the marginal social benefit from the last pound of coffee exceeds its marginal social cost.
D) inefficient because the marginal social cost of the last pound of coffee exceeds its marginal social benefit.
D
You might also like to view...
Refer to Figure 9.8. If free trade in sugar is replaced by a $50 tariff in sugar, government revenue from the tariff will be
A) $50. B) $5000. C) $15,000. D) $17,500. E) $25,000.
The demand curve for investment in the economy as a function of interest rates is:
a. vertical. b. horizontal. c. upward sloping. d. downward sloping. e. elliptical.
If the price of land is zero,
a. the supply of land is a horizontal line b. rent is zero and land is a free good c. the MRP curve is positively sloped d. land rents are positive e. demand for land is relatively high
What is the equilibrium price?
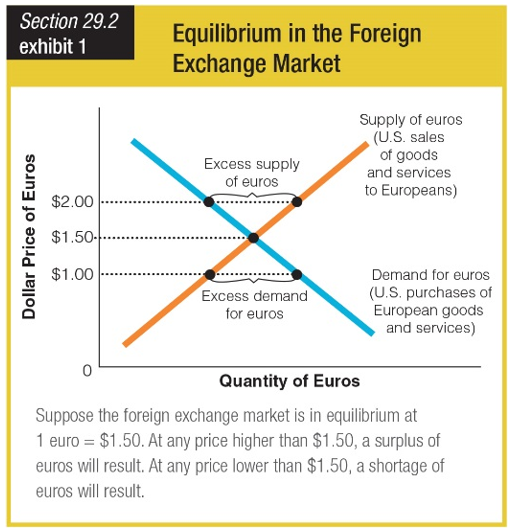
a. 1 euro = $2.00
b. 2 euro = $1.50
c. 2 euro = $2.00
d. 1 euro = $1.50