Solve the problem.The function f models the population of Country X from 1991 to 1998. The graphs of f and the horizontal line y = 230 are shown in the figure. Use the graphs to determine when there was (i) a population equal to 230 million and (ii) a population of 230 million or less. 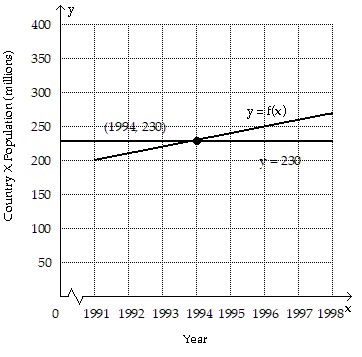
A. 1994; after 1994
B. 1995; between 1991 and 1995
C. between 1994 and 1998; earlier than 1994
D. 1994; between 1991 and 1994
Answer: D
You might also like to view...
Graph the function.Graph two periods of the function f(x) = -cot  + 1.
+ 1.
A. 
B. 
C. 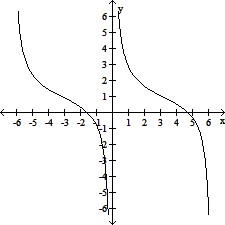
D. 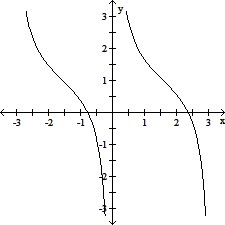
Simplify.
A. 
B. 8s + 7t
C. 
D. 7s + 8t
For the polynomial, list each real zero and its multiplicity. Determine whether the graph crosses or touches the x-axis at each x -intercept.f(x) = 4(x - 6)(x - 7)2
A. -6, multiplicity 1, crosses x-axis; -7, multiplicity 2, touches x-axis B. -6, multiplicity 1, touches x-axis; -7, multiplicity 2, crosses x-axis C. 6, multiplicity 1, crosses x-axis; 7, multiplicity 2, touches x-axis D. 6, multiplicity 1, touches x-axis; 7, multiplicity 2, crosses x-axis
Solve.Find the perimeter of the figure below.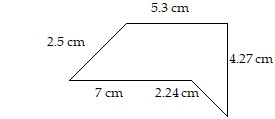
A. 15.01 cm B. 7.99 cm C. 14.29 cm D. 21.31 cm