Solve the problem.The following data represents the normal monthly precipitation for a certain city.  Draw a scatter diagram of the data for one period. Find the sinusoidal function of the form
  that fits the data. Draw the sinusoidal function on the scatter diagram. Use a graphing utility to find the sinusoidal function of best fit. Draw the sinusoidal function of best fit on the scatter diagram.
What will be an ideal response?
y = 2.17 sin(0.49x - 1.88) + 6.02;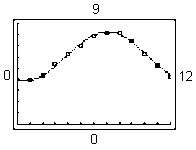
Mathematics
You might also like to view...
Use common logarithms or natural logarithms and a calculator to evaluate to four decimal placeslog0.2 15
A. 0.4771 B. 1.8751 C. -1.6826 D. -0.5943
Mathematics
Graph the inequality.x > -6
A. 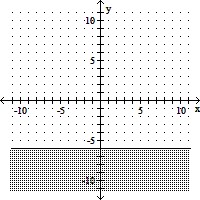
B. 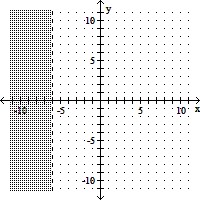
C. 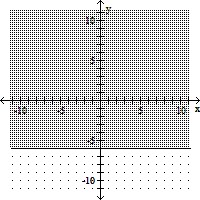
D. 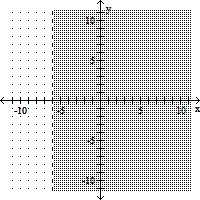
Mathematics
Factor the expression. Express your answer so that only positive exponents occur. 10x1/7 - 13x-4/7
A. x1/7(10x5/7 - 13x5/13) B. x-4/7(10x5/7 - 13x) C. x-4/7(10x5/7 - 13) D. x1/3(10 - 13x5/13)
Mathematics
Solve the linear equation with the intersection-of-graphs method. Approximate the solution to the nearest hundredth if necessary.8x + 6.7 = 3.7
A. 0.45 B. 1.3 C. -0.37 D. 0.38
Mathematics