Graph the linear equation.y = - 5
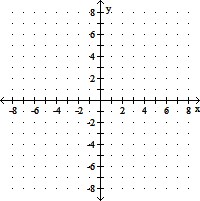
A. 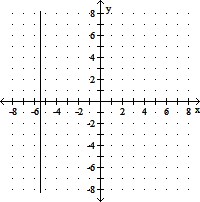
B. 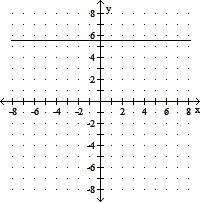
C. 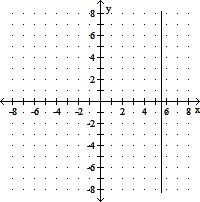
D. 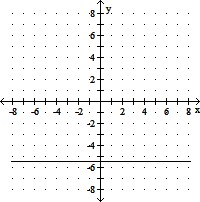
Answer: D
You might also like to view...
Use the pictograph to answer the question.For selected countries, this pictograph shows approximately how many kilograms of seafood is consumed by each person (per capita) annually. Which country consumes the least seafood?
A. Country C B. Country D C. Country B D. Country E
Multiply and simplify any radicals in your answer. Assume that all variables represent positive real numbers.

A. 2
B. 
C. 2
D. 
Find the function value.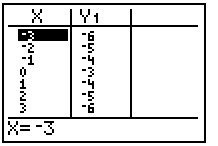 f(2) if f(x) = Y1
A. -3 B. -6 C. -5 D. -4
Solve the problem.The concentration of a certain gas molecule in the atmosphere serves as an indicator of industrial air pollution. The data in the following table show the relationship of the estimated concentration of the molecule in the atmosphere, in parts per billion (ppb), to the year.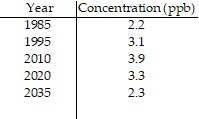 Take 1985 as year zero, and determine the linear, quadratic, or cubic function that best fits the data.
A. f(x) = -0.003x2 + 0.12x + 2.19 B. f(x) = -0.002x2 + 0.12x + 2.19 C. f(x) = 0.00001x3 - 0.003x2 + 0.14x + 2.16 D. f(x) = 0.002x + 2.90