Find the indicated control limits.For a production process for which there is a great deal of data since its last modification, the population mean ? and the population standard deviation ? are assumed known. For such a process we have the following values for an R chart:central line = d2?, UCL = D2?, LCL = D1?(The values of d2, D1, and D2 are found in the table of control chart factors). In a bottling factory, after bottling, the volume of juice in seven sample bottles is checked every 30 minutes. For this process,  and
and  Find the central line, UCL, and
LCL for the range.
A. 0.08, 0.160, 0.000
B. 0.216, 0.416, 0.016
C. 0.216, 0.154, 0.006
D. 0.203, 0.406, 0.000
Answer: B
Mathematics
You might also like to view...
Solve the problem.Which of the following is not a possible Shapley-Shubik power index for a player in a weighted voting system with four players?
A. 
B. 
C. 
D. 
E. none of these
Mathematics
Sketch the graph of the equation.x2 + y2 = 81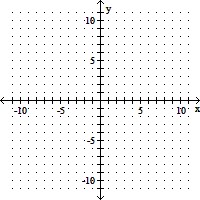
A. 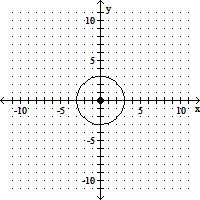
B. 
C. 
D. 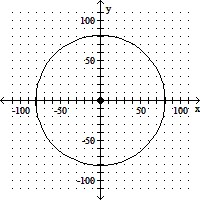
Mathematics
Simplify the expression so that no negative exponents appear in the final result. Assume all variables represent nonzero numbers. -2
-2
A. 
B. 
C. 
D. 
Mathematics
Determine whether the sequence is geometric.an = 13n - 2
A. Geometric B. Not geometric
Mathematics