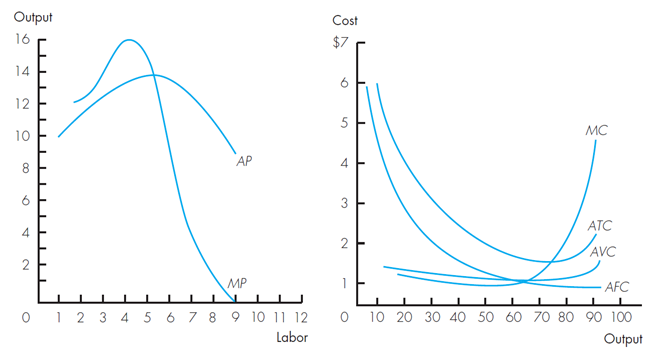
Draw two graphs: one showing the relationship of average product, marginal product, and total product; the other showing the relationship of AFC, AVC, and ATC. Then relate the shape of the marginal product to that of the marginal cost.
What will be an ideal response?
ANS:
Students can draw these graphs by using Figures 5-1 and 5-2 as references, if necessary. Students should observe that as the marginal product rises, the marginal cost declines; and as the marginal product declines, the marginal cost rises. A similar relationship holds with average product and average variable cost.
You might also like to view...
Over time, a country's real GDP per capita typically
A) shrinks B) grows. C) increases and decreases randomly. D) remains stable.
When an individual or firm in the United States requests that a bank sell foreign exchange, the bank will probably
A) call a foreign bank and arrange a purchase. B) call the central bank and arrange a purchase. C) call another bank customer with foreign exchange holdings. D) call another domestic bank and arrange a purchase. E) call a foreign exchange broker and arrange a purchase.
For investors, commercial paper is a close substitute for
A) U.S. Treasury bills. B) U.S. Treasury bonds. C) corporate bonds. D) municipal bonds.
The figure below shows the market for computers in a small importing country. Dd and Sd are the domestic demand and supply curves of computers, respectively.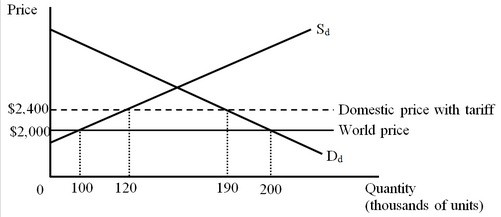 The imposition of a tariff on computers caused economic well-being in the country to ________ by
A. fall; $6 million. B. rise; $34 million. C. fall; $34 million. D. fall; $4 million.