In the graph showing the data for the short-run and long-run Phillips curve from 1979–1987, movement along the short-run Phillips curve is represented by the move from ______.
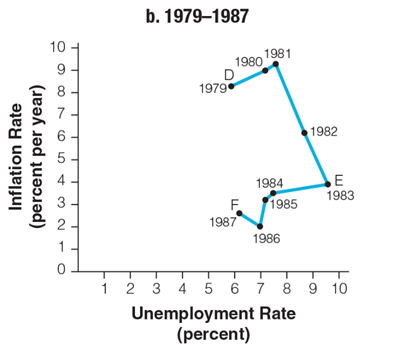
a. Point D to Point E
b. Point D to Point F
c. Point E to Point F
d. Point F to Point D
a. Point D to Point E
You might also like to view...
A monopolistically competitive firm is making a positive economic profit. In the long run, which of the following is most likely?
A) It will produce less output and it will charge a lower price. B) It will produce the same output and charge the same price. C) It will produce less output but keep price the same. D) It will keep output the same but will charge a higher price.
Refer to Figure 18-1. The depreciation of the euro is represented as a movement from
A) B to A. B) D to A. C) C to D. D) B to C.
Households interact with business firms by:
a. buying resource services from business firms. b. paying wages for the use of labor. c. selling goods and services to firms. d. receiving payments from firms for use of resource services. e. paying rent to firms for the use of land.
If AS increases at a faster rate than AD, the result will be
A. demand-side inflation. B. supply-side inflation. C. falling prices. D. stable prices.