Use the following table to answer the next question.YearReal GDPPopulation2008$20,000200200940,000400201060,000400201170,000500In 2009, real GDP per capita equals ________.
A. $20,000
B. $100
C. $1,000
D. $2,000
Answer: B
You might also like to view...
Individuals will make choices to maximize their:
A. constraints. B. utility. C. income. D. values.
Suppose there are 100 firms each with a short run total cost of STC = q2 + q + 10, so that marginal cost is MC = 2q +1 . If market demand is given by QD = 1050 ? 50P, how much will be produced in the market?
a. 300 b. 400 c. 500 d. 600
A decrease in the price of electricity can best be explained by
A. A growing economy. B. Abnormally cold winters and hot summers. C. The increased use of electronic devices such as computers. D. A decrease in the population.
Refer to the information provided in Figure 23.3 below to answer the question(s) that follow.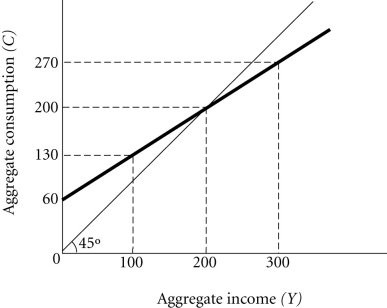 Figure 23.3Refer to Figure 23.3. Aggregate saving is $240 if aggregate income is
A. $300. B. $500. C. $800. D. $1,000.