This graph depicts a tax being imposed, causing demand to shift from D1 to D2. The amount of tax revenue being generated by the tax imposed in the graph shown is:
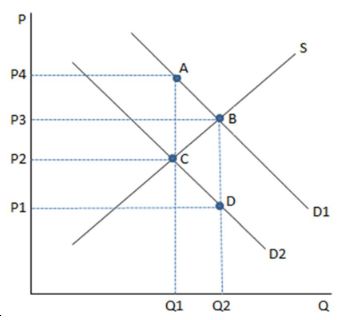
A. area P2CAP4.
B. area P1DBP3.
C. area ABC.
D. area ABCD.
A. area P2CAP4.
You might also like to view...
The above table has the total revenue and total cost schedule for Omar, a perfectly competitive grower of rutabagas. When Omar maximizes his profit, Omar's profit equals
A) $80. B) $11. C) $30. D) $16. E) $105.
Refer to Figure 18-1. Currency speculators believe that the value of the euro will decrease relative to the dollar. Assuming all else remains constant, how would this be represented?
A) Supply would increase, demand would decrease and the economy moves from C to B to A. B) Supply would decrease, demand would decrease and the economy moves from B to C to D. C) Supply would increase, demand would increase and the economy moves from D to A to B. D) Supply would decrease, demand would increase and the economy moves from A to D to C.
New smartphone applications are developed to help consumers find the cheapest prices in the neighborhood. As a result,
A) firms get greater market power. B) consumers' search costs are greatly lowered. C) firms are able to charge higher prices. D) only smart markets become more competitive.
What are the disadvantages of adopting a single currency? Explain
What will be an ideal response?