The bar graph below shows the recorded high temperatures in Little City for the indicated months. 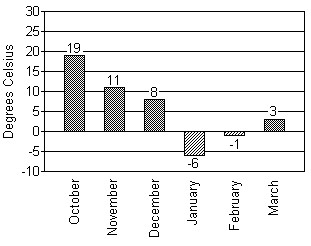 In which month was the recorded temperature the highest?
A. February
B. October
C. January
D. March
Answer: B
You might also like to view...
Find the product.(x - 2.2)(2x + 0.2)
A. 2x2 + 4.2x + 0.44 B. 3x2 + 4.2x - 2 C. 2x2 - 4.2x - 0.44 D. 3x2 - 4.2x + 2
Calculate the number of distinguishable strings that can be formed with the stated letters.3 c's and 8 d's
A. 165 B. 11 C. 990 D. 24
Solve the problem.A pest control company sprays insecticide around the perimeter of a 270 ft by 130 ft building. If the spray costs $0.13 per foot, how much did the job cost to the nearest dollar?
A. $52 B. $4563 C. $380 D. $104
Start with the graph of y = ex. a) Describe a sequence of transformations that results in the graph of y = f(x); b) Find the range of f(x); c) Find the horizontal asymptote of the graph of f.f(x) = 4e2x - 1 + 9
A. a) The graph of y = ex is compressed horizontally by a factor of 2, shifted 1 unit to the right, stretched vertically by a factor of 4, and shifted up nine units.
b) (9, ?)
c) y = 9
B. a) The graph of y = ex is compressed horizontally by a factor of  , shifted
  unit to the right, stretched vertically by a factor of 4, and shifted up nine units.
b) (9, ?)
c) y = 9
C. a) The graph of y = ex is compressed horizontally by a factor of  , shifted
  unit to the right, stretched vertically by a factor of 4, and shifted down nine units.
b) (-9, ?)
c) y = -9
D. a) The graph of y = ex is compressed horizontally by a factor of  , shifted
  unit to the left, stretched vertically by a factor of 4, and shifted up nine units.
b) (9, ?)
c) y = 9