Use dot mode to graph the function f in the standard viewing rectangle. Evaluate f for the given x-values.f(x) = [[x + 3]] at x = -2.5 and x = 0.8
A. 
f(-2.5) = 0, f(0.8) = 3
B. 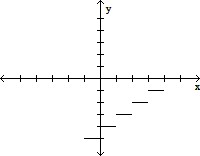
f(-2.5) = 1, f(0.8) = 2
C. 
f(-2.5) = 0, f(0.8) = 2
D. 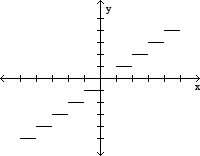
f(-2.5) = -2, f(0.8) = 0
Answer: A
Mathematics
You might also like to view...
Find the missing data value in the following frequency table that would make the mean equal to 8. Data Values Frequency 3 3 6 2 8 3 11 4 ? 1 ?
A. ?13 B. 15 C. ?12 D. 19 E. ?11
Mathematics
Name the set using the roster method.The set of even numbers between 5 and 9
A. ? B. {5, 6, 7, 8, 9} C. {6, 7, 8} D. {6, 8}
Mathematics
Graph the inequality.y ? -7 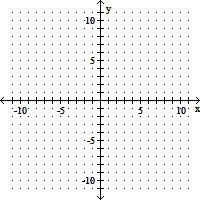
A. 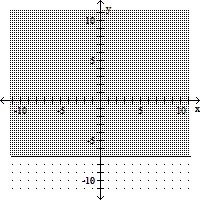
B. 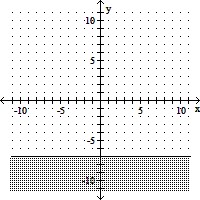
C. 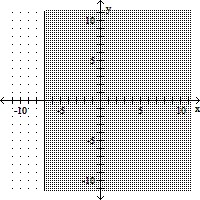
D. 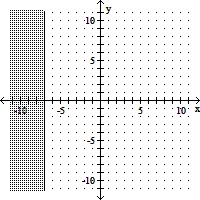
Mathematics
Graph.y =log1/3x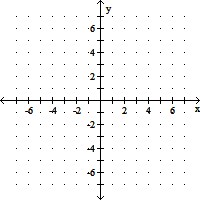
A. 
B. 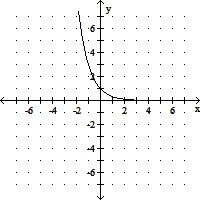
C. 
D. 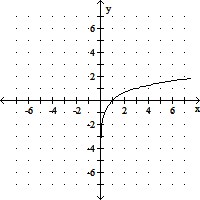
Mathematics