Graph the function by first finding the relative extrema.f(x) = 
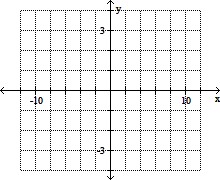
A. 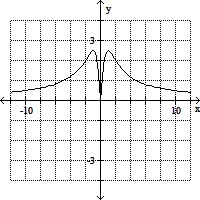
B. 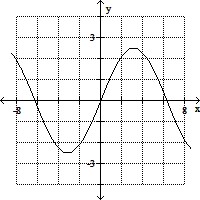
C. 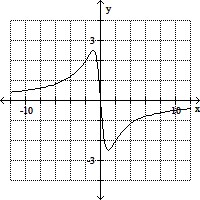
D. 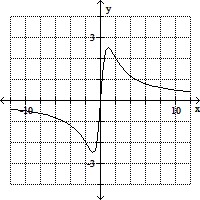
Answer: D
You might also like to view...
Find the domain and range for the indicated function.f(x) = 6, g(x) = 6 +
  ;
; f/g
f/g
A. D: x ? 0 R: y ? 1 B. D: x ? 0 R: y ? 6 C. D: x ? -6 R: y ? 0 D. D: x ? 0 R: y ? 1
Express as a difference of logarithms.loga 
A. loga D - loga P B. loga D ÷ loga P C. loga P - loga D D. loga (D - P)
Solve the problem.The table below shows the results of a consumer survey of annual incomes in 100 households. 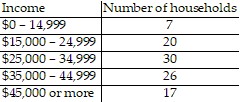 What is the probability that a household has an annual income less than $25,000?
A. 0.27 B. 0.73 C. 0.57 D. 0.2
Combined SAT scores in the United States could be approximated by
?
?
in the years 1967 - 1990. Here t is the number of years since 1967, and T is the combined SAT score average for the United States. Find all points of inflection of the graph of T, and interpret the result. Round coordinates to two decimal places if necessary.
?
A. (11.75, 989.90), (26.90, 1007.45)
B. (19.33, 998.67)
C. (23, 1004.56)
D. (0, 0)
E. (0, 0), (23, 1004.56)

