A supply schedule shows
A. the “market potential” for a product.
B. how much producers are willing and able to sell at different prices.
C. possible combinations of output under different conditions.
D. how much consumers would like to buy at different prices.
E. All of these responses are correct.
Answer: B
You might also like to view...
Demand elasticity can be
A) elastic, unit, or free. B) elastic or inelastic. C) elastic, inelastic, or unit elastic. D) 1, -1, or 0.
Last year real GDP in the imaginary nation of Populia was 907.5 billion and the population was 3.3 million. The year before real GDP was 750 billion and the population was 3 million. What was the growth rate of real GDP per person during the year?
a. 10 percent b. 14 percent c. 17 percent d. 21 percent
The notion that the money in your possession will buy less when the price rises is provided as the explanation for
A. the real-balances effect. B. diminishing marginal utility. C. the substitution effect.
Refer to the information provided in Figure 2.5 below to answer the question(s) that follow.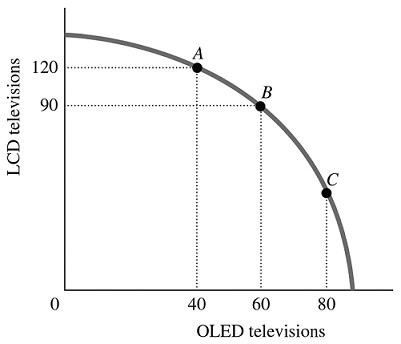 Figure 2.5Refer to Figure 2.5. The economy is currently at Point A. The opportunity cost of moving from Point A to Point B is the
A. 30 LCD televisions that must be forgone to produce 60 additional OLED televisions. B. 90 LCD televisions that must be forgone to produce 20 additional OLED televisions. C. 30 LCD televisions that must be forgone to produce 20 additional OLED televisions. D. 120 LCD televisions that must be forgone to produce 40 additional OLED televisions.