Figure 4.5 illustrates a set of supply and demand curves for hamburgers. A decrease in supply and a decrease in demand are represented by a movement from
A) point b to point d. B) point c to point a. C) point a to point b. D) point d to point a.
A
You might also like to view...
If a good has a price elasticity of demand equal to 0, ________
A) the percentage change in quantity demanded for the good will be greater than the percentage change in its price B) the demand curve of the good is upward sloping C) the smallest increase in its price causes consumers to stop consuming it completely D) the quantity demanded is completely unaffected by a change in its price
The price elasticity of demand for corn is 0.4. A new hybrid of corn is discovered and all farmers start to use it, which increases the quantity of corn they can produce from each acre. What happens to the farmers' total revenue?
A) The total revenue will increase. B) The total revenue will decrease. C) The total revenue will not change. D) There is not enough information to determine what happens to the total revenue.
If the economy is in a recession, which point in the graph shown would likely represent this?
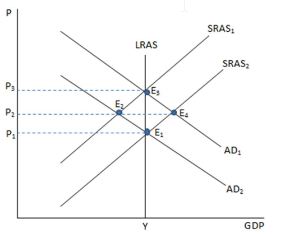
A. E1
B. E2
C. E3
D. E4
Suppose there are two small island countries: Avarice, which is populated by people who are completely self-interested, and Altruism, which is populated by people who have adopted social norms of generosity and cooperation. Commitment problems will be:
A. largely avoided in Altruism, but prevalent in Avarice. B. prevalent on both islands. C. largely avoided in Avarice, but prevalent in Altruism. D. largely avoided on both islands.