Make a line graph of the data.The following table gives the total amount of precipitation during the given months. Use time on the horizontal scale for your line graph.
What will be an ideal response?
Answers may vary. A possible answer follows.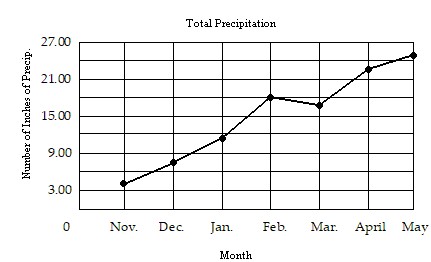
You might also like to view...
Answer the question.The strengths of the last 5 major earthquakes to hit California have differed by factors of 10. If you were to display data describing the strengths of these earthquakes what could you use to make the graph more readable?
A. A three dimensional graph B. An exponential scale C. A stack plot D. A color coded map
The Richter scale converts seismographic readings into numbers for measuring the magnitude of an earthquake according to this function M(x) = log  , where x0 = 10-3.What is the magnitude of an earthquake whose seismographic reading is 0.94 millimeters at a distance of 100 kilometers from its epicenter? Round the answer to four decimal places.
A. -0.0269 B. -3.0269 C. 0.9731 D. 2.9731
Solve the problem.Noah and Ben are running in the Walker Street Fun Run. Noah runs at 7 mph, Ben at 5 mph. If they start at the same time, how long (in minutes) will it be before they are  mile apart?
A. 10 min B. 6 min C. 24 min D. 150 min
Let x be a number. Translate the English phrase or sentence into a mathematical expression. A number decreased by six
A. 
B. x - 6
C. x + 6
D. 6 - x