The figure below represents the effects in the labor markets due to migration. Here, the world has been divided into a high-income "North" (left panel) and a low-income "South" (right panel). Dn and Sn are the labor demand and the labor supply curves in North. Ds and (Sr + Smig) are the labor demand and pre-migration labor supply curves in South. Sr is the post-migration labor supply curve in South. The value c is the cost of migrating.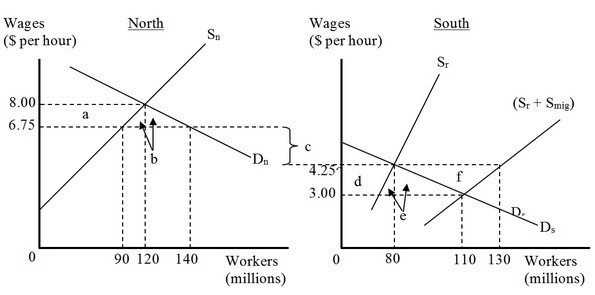 When migration between North and South is allowed, how many workers will choose to migrate to North?
A. 40 million
B. 30 million
C. 20 million
D. 50 million
Answer: D
You might also like to view...
Which of the following markets must clear if injections from the income-spending stream are to equal leakages from the stream?
a. The resource market b. The labor market c. The goods market d. The aggregate market e. The loanable funds market
Other things the same, if technology increases, then in the long run
a. both output and prices are higher. b. output is higher and prices are lower. c. output is lower and prices are higher. d. both output and prices are lower.
The average total cost at the profit-maximizing/loss-minimizing amount is a little over
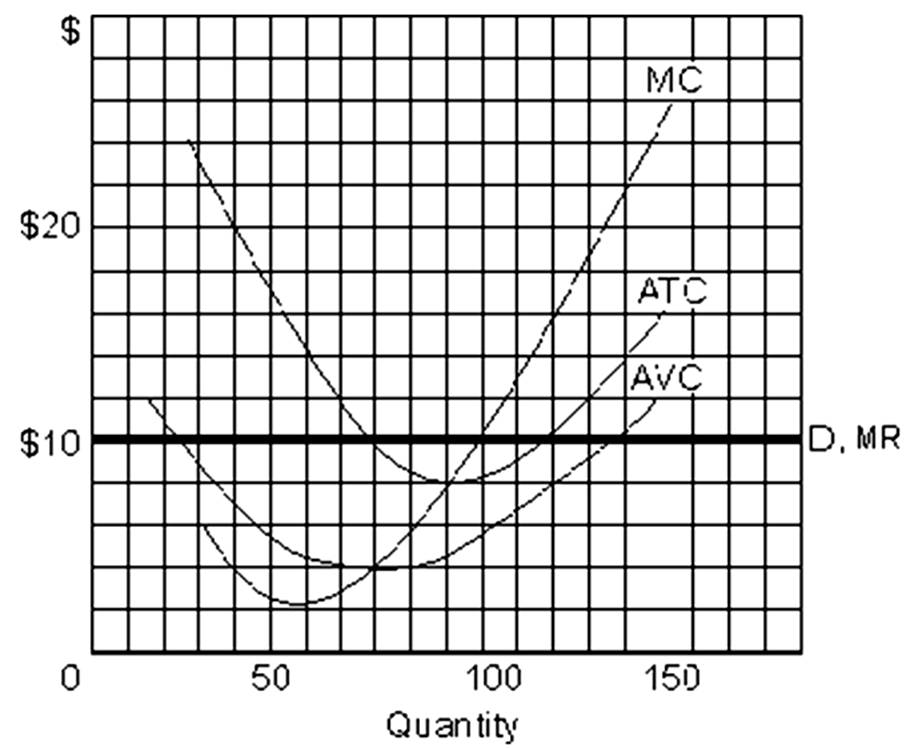
A. $8 per unit.
B. $9 per unit.
C. $10 per unit.
D. $11 per unit.
Average fixed costs rise continuously as quantity of output rises.
a. true b. false