Use the following diagram to answer the next question.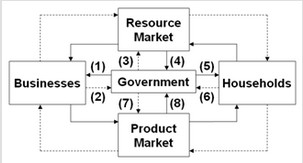 In the diagram, solid arrows reflect real flows and broken arrows are monetary flows. Flow (3) might represent
A. government salaries paid to school teachers.
B. a state university's purchase of computers.
C. property tax payments.
D. social security payments to retirees.
Answer: A
You might also like to view...
The prices college students and faculty members pay for Apple computers are lower than the prices Apple charges on its Web site and in retail stores. Apple charges lower prices to college students and faculty members because
A) college students and faculty members have a more elastic demand for computers than the general public. B) college students and faculty members typically buy more supplies from Apple (print cartridges, paper, etc.,) than the general public. C) college students and faculty members have a more inelastic demand for computers than the general public. D) Apple can deduct from its federal taxes some of the costs of the computers it sells to college students and faculty members.
In the above table, the cross price elasticity of demand (using averages) for Z with good X, when PX increases from $12 to $15, is approximately equal to
A) +1.03 B) +2.26. C) +0.44. D) -0.44.
Suppose the demand for tacos decreases. What will happen to producer surplus in the market for tacos?
a. It increases. b. It decreases. c. It remains unchanged. d. It may increase, decrease, or remain unchanged.
Social costs are
A. borne by individuals who incur them. B. borne by no one in society. C. the full cost borne by society whenever a resource use occurs. D. costs that are borne by the government.