The graphs show the sales of two companies competing for market share. Use the graphs to answer the question.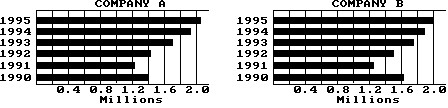 During which years were the sales of Company B greater than or equal to 1.8 million items?
A. 1990, 1991, 1992
B. 1994, 1995
C. 1993, 1994, 1995
D. 1990, 1991, 1992, 1993
Answer: B
Mathematics
You might also like to view...
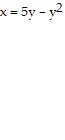
Use the shell method to find the volume of the solid generated by revolving the shaded region about the indicated line.About the line y = 5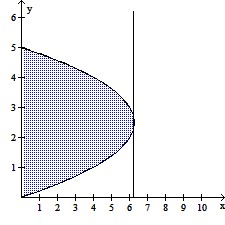
A.  ?
?
B.  ?
?
C.  ?
?
D.  ?
?
Mathematics
Find the equation of the parabola corresponding to the given information.The parabola has focus ( 0 , -3 ) and directrix y = 3.
A. x = -  y2
y2
B. y = - x2
C. y = -  x2
x2
D. y =  x2
x2
Mathematics
Write the expression in the standard form a + bi.(6 + 2i)(6 - 2i)
A. 32 B. 36 - 4i C. 36 - 4i2 D. 40
Mathematics
Provide an appropriate response.How does one decide whether a set of points is included in the domain of a function? In the range?
What will be an ideal response?
Mathematics