Assume that the graphs show a competitive market for the product stated in the question below.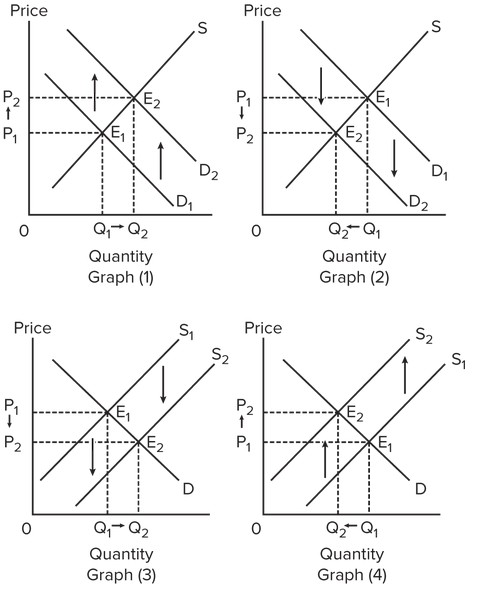 Select the graph above that best shows the change in the market following a reduction in the tax placed on the suppliers in the market.
A. graph (1)
B. graph (2)
C. graph (3)
D. graph (4)
Answer: C
You might also like to view...
Since 1982, banks and thrift institutions have offered a type of savings account that yields a market rate of interest with a minimum balance and a limit on transactions. These accounts, which have no minimum maturity, are known as
A) money market mutual funds. B) repurchase agreements. C) certificates of deposit. D) mutual funds.
Which of the following will not change the U.S. real interest rate?
a. capital flight from the United States b. the government budget deficit increases c. the U.S. imposes import quotas d. None of the above is correct.
In order to make oil profits as large as possible, OPEC meets to set oil production quotas for its members. OPEC is best classified as a:
A. monopoly. B. cartel. C. a monopolistically competitive industry. D. price-leadership industry.
More than half the growth of real GDP in the United States is caused by:
A. a falling price level. B. the reallocation of labor from manufacturing to agriculture. C. increases in the productivity of labor. D. the use of fewer inputs of labor.