Solve the problem.Use the following graph which shows the number of customer service calls to a major appliance manufacturer, in millions, for the years 2006-2012. Use the graph to represent the set in roster form.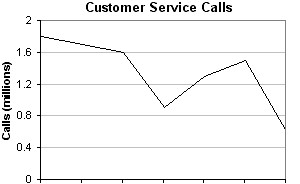 2006200720082009201020112012YearThe set of years in which the number of customer service calls were below 1.1 million.
A. {2012}
B. {2009, 2010, 2012}
C. {2008, 2009, 2012}
D. {2009, 2012}
Answer: D
Mathematics
You might also like to view...
Integrate the function. d?
d?
A.  sin 2? -
  cos3 2? + C
B. 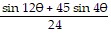 + C
+ C
C.  + C
+ C
D.  sin 2? -
  cos3 2? + C
Mathematics
Express the limit as a definite integral where P is a partition of the given interval.lim ?0
?0 ?xk, [-6?, 6?]
A.  dx
dx
B.  dx
dx
C.  dx
dx
D.  dx
dx
Mathematics
Use a calculator to solve for x. Round to the nearest thousandth.
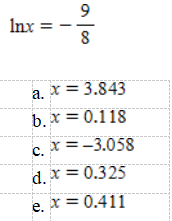
Mathematics
Evaluate the iterated integral.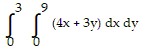
A. 
B. 
C. 
D. 
Mathematics