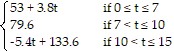
Use the graph to solve the problem.In one city, the temperature in Fahrenheit on a typical summer day can be approximated by the following function:
 Here, t represents the number of hours since
  The graph of this function is shown below. At what time does it start to get cooler?
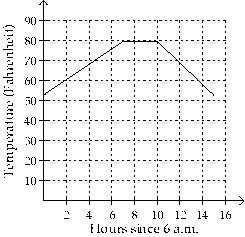
A. At 3 p.m.
B. At 1 p.m.
C. At 10 a.m.
D. At 4 p.m.
Answer: D
You might also like to view...
Determine the limit by sketching an appropriate graph. f(x), where f(x) =

A. -13 B. -3 C. -4 D. 8
Answer the question appropriately.Where does the periodic function f(x) = 5esin(x/2) take on its extreme values?
A. x = ±k?/5 where k is an even integer B. x is an odd integer C. x = ±k? where k is an even integer D. x = ±k? where k is an odd integer
If you changed the following decimal into a fraction and reduced it to lowest terms, what would be its denominator?
?
 ?
?
A. 90 B. 9 C. 999 D. 9999 E. 99
For points  in quadrant IV, the ratio
  is always negative because x is always positive and y is always negative. In what other quadrant is the ratio
src="https://sciemce.com/media/3/ppg__cognero__Section_1.2_The_Rectangular_Coordinate_System__media__cb09832f-5ffc-4bd3-af11-e10a5b998974.PNG" style="font-size: 14.6667px; font-family: 'times new roman'; vertical-align: middle;" /> always negative? What will be an ideal response?