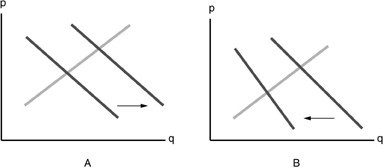
 Refer to the above figure. Suppose that Cheerios and Apple Jacks are substitutes. Which diagram shows the effect on the demand for Cheerios when the price of Apple Jacks cereal has decreased?
A. A
B. B
C. neither graph
D. both graphs
Answer: B
You might also like to view...
The price of good X is $2.00 and the price of good Y is $1.00. Last year, the price of good X was $1.00 and the price of good Y was $2.00. If a consumer has $100, draw there their budget line for each year (label them accordingly). Add as many indifference curves as needed to show a situation in which the consumer is no better or worse off this year than they were last year. Be sure to label their optimal baskets for both years. Explain why what you have drawn is correct.
What will be an ideal response?
For a profit maximizing monopolist, if the MC = 10 and price is set to be 20, then the elasticity at this price is
A) -2. B) -1. C) -0.5. D) 0.
Which of the following is the ultimate goal of monetary policy?
a. Complete removal of income inequality b. Economic growth with price stability c. Free trade d. Balanced budget e. Economic welfare
Transfers of assets, such as stock sales are:
A. included in GDP because they increase domestic wealth. B. included in GDP because they raise domestic production. C. not included in GDP because they do not increase domestic wealth. D. not included in GDP because they do not increase domestic production.