Listed below is a company's sales inYear 1 through Year 12 along with the national income of the country, where thebusiness is set up.
Year
National Income (in millions of dollars) x
Company's sales (in thousands of dollars) y
Year 1
305
470
Year 2
316
485
Year 3
358
499
Year 4
350
515
Year 5
375
532
Year 6
392
532
Year 7
400
556
Year 8
398
576
Year 9
430
583
Year 10
456
587
Year 11
578
601
Year 12
498
605
Test whether each of the regression parameters?0 and?1 is equal to zero at a 0.05 level of significance. What are the correct interpretations of the estimated regression parameters?
What will be an ideal response?
The Excel plot of the residuals and market capitalization follows.

Because we are working with only 12 observations, assessing the conditions necessary for inference to be valid in regression is extremely difficult. However, this scatter chart does not provide strong evidence of a violation of the conditions, so we will proceed with our inference.
Excel output: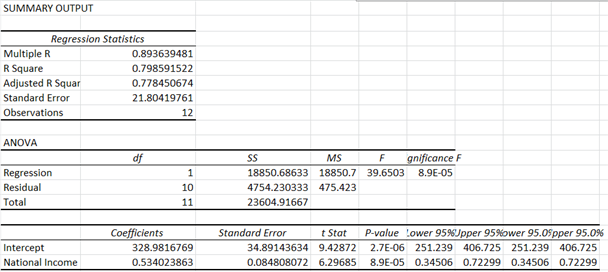
The p value associated with the estimated regression parameter b1 is 8.9E-05, which is 0.000089, or approximately equal to 0. Because this p value is less than the 0.05 level of significance, we reject the hypothesis that?1= 0. Hence, we conclude that there is a relationship between national income and the company's sales, and, on average, a $1 million increase in national income corresponds to an increase of $534.02 in the company's sales. The company's sales are expected to increase as national income increases, so this result is consistent with what is expected.
The p value associated with the estimated regression parameter b0 is 2.7E-06 which is 0.0000027, or approximately equal to 0. Because this p value is less than the 0.05 level of significance, we reject thehypothesisthat?0= 0. The estimated regression parameter b0 suggests that when national income is zero, the company's sales are $328,981, which is not a realistic estimate.
You might also like to view...
In the United States, the average annual real return on stocks from 1960 to 2012 has been approximately
A. 1 percent. B. 2 percent. C. 7 percent. D. 10 percent.
An initial analysis of a laboratory activity resulted in the first table below
After this analysis, the managers determined that their element descriptions were not as accurate as they should have been–they had left out an element, underestimated a distance, and understated the need for accuracy. They revised the table of element data, which appears in the second table. Original Activity: Pouring tube specimen Element description Element code TMU Get tube from rack AA2 35 Get stopper, place on counter AA2 35 Get centrifuge, place at sample tube AD2 45 Pour (3 sec.) PT 83 Place tubes in rack (simo) PC2 40 TOTAL TMU Revised Activity: Pouring tube specimen Element description Element code TMU Get tube from rack AC3 70 Get stopper, place on counter AA2 35 Get centrifuge, place at sample tube AD2 45 Pour (3 sec.) PT 83 Get stopper, place on tube AC1 40 Place tubes in rack (simo) PC2 40 TOTAL TMU Calculate the total standard minutes for the original activity "pouring tube specimen." Calculate the total standard minutes for the revised activity "pouring tube specimen." What is the increase, in seconds, from the first version to the second? (Round calculations to four decimal places.)
Which of the following statements about moving averages is not true?
a. It can be used to smooth a series b. It gives equal weight to all values in the computation c. It is simpler than the method of exponential smoothing d. It gives greater weight to more recent data
If a distribution of stock rights is taxable and their fair market value is less than 15 percent of the value of the old stock, then either a zero basis or a portion of the old stock basis may be assigned to the rights at the shareholder’s option.
Answer the following statement true (T) or false (F)