The figure below illustrates a tariff. On the graph, Q represents quantity and P represents price.
Figure 17-11
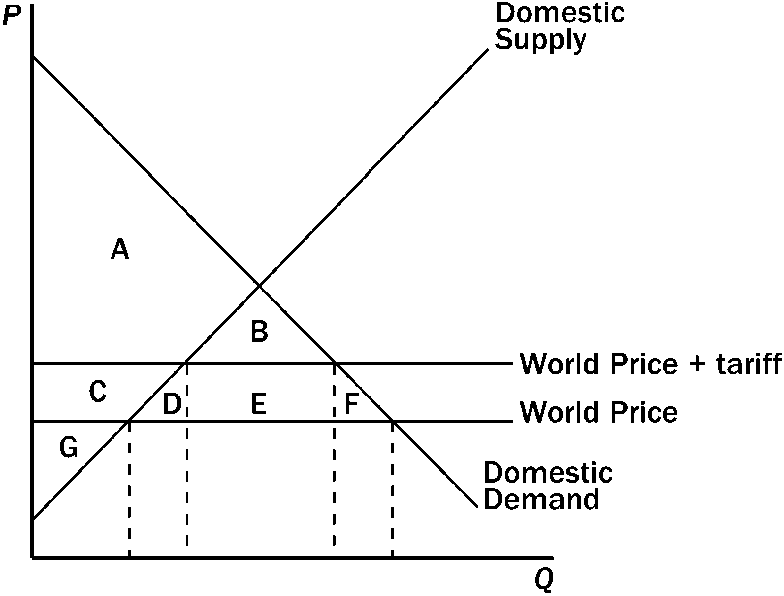
Refer to Figure 17-11. The tariff
a.
decreases producer surplus by the area C and decreases consumer surplus by the area C + D + E + F.
b.
decreases producer surplus by the area C + D and decreases consumer surplus by the area D + E + F.
c.
increases producer surplus by the area C and decreases consumer surplus by the area C + D + E + F.
d.
increases producer surplus by the area B + C and decrease consumer surplus by the area D + E + F.
c
You might also like to view...
Consumer surplus can be defined as the difference between:
a) the demand curve and the price of the good. b) the supply curve and the price of the good. c) the supply curve and the demand curve. d) the price charged by sellers and the price paid by buyers.
When Mr. Peabody decides on the companies to which he will donate his time and money, a ________ issue is being addressed
A) microeconomic B) normative economic C) positive economic D) macroeconomic
Over the years, there have been many programs designed to help the poor. One of the more popular ones has been the Earned Income Tax Credit (EITC). What makes this program so popular?
What will be an ideal response?
In Econland exports equal 25 percent of total output, while imports equal 20 percent of total output. Econland has a:
A. budget surplus. B. trade deficit. C. budget deficit. D. trade surplus.