In the above figure, the output of an oligopoly will range between
A) 0 and Q1.
B) Q1 and Q2.
C) Q1 and Q3.
D) Q2 and Q3.
E) 0 and Q2.
B
You might also like to view...
Who had served as a de facto lender of last resort during the 1907 panic?
A) The U.S. Treasury B) J. P. Morgan C) Henry Ford D) John D. Rockefeller
As a researcher, which aspect of the results would be of greatest concern?
A) the negative value of the constant (i.e., -6,500) B) the relatively low impact of the competitor's price C) the fact that not all of the variables are statistically significant D) the poor fit of the regression line
The reserve ratio is the ratio of: a. Federal Reserve member banks to nonmember banks. b. Federal Reserve nonmember banks to member banks. c. Federal Reserve member banks to all U.S. banks
d. a bank's total deposits to its reserves. e. a bank's reserves to its total deposits.
Using Figure 1 above, if the aggregate demand curve shifts from AD1 to AD2 the result in the long run would be: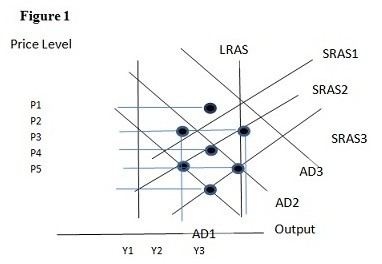
A. P1 and Y2. B. P2 and Y2. C. P3 and Y1. D. P2 and Y3.