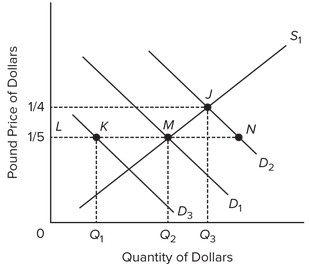
Use the following graph, which shows the supply and demand curves for dollars in the pound/dollar market, to answer the next question. Assume that D1 and S1 represent the initial demand for and supply of dollars. The exchange rate at this equilibrium would be ________.
A. $0.20 = 1 pound
B. $4 = 1 pound
C. $1 = 5 pounds
D. $5 = 1 pound
Answer: D
You might also like to view...
The analysis of how a customer's tastes for cars will change when his wealth triples is under the scope of:
A) ordinal study. B) comparative statics. C) marginal research. D) Pareto analysis.
Of the following, the largest component of GDP is
A) personal consumption expenditure. B) gross private domestic investment. C) government expenditure on goods and services. D) net exports of goods and services.
In a closed economy, the impact to aggregate demand from a decrease in fiscal spending is
A) a shift to the left. B) zero. C) a shift to the right. D) reversed by changes in the exchange rate.
An increase in the inflation rate shifts the labor
A) supply curve to the right. B) supply curve to the left. C) demand curve to the right. D) demand curve to the left.