Use a graphing calculator to plot the data and find the quadratic function of best fit.The number of housing starts in one beachside community remained fairly level until 1992 and then began to increase. The following data shows the number of housing starts since 1992 (x = 1). Use a graphing calculator to plot a scatter diagram. What is the quadratic function of best fit?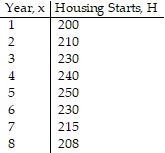
A. H(x) = -3.268x2 + 30.494x + 168.982
B. H(x) = 3.268x2 + 30.494x + 168.982
C. H(x) = -3.268x2 + 30.494x - 168.982
D. H(x) = -3.268x2 - 30.494x + 168.982
Answer: A
You might also like to view...
Use the integral test to determine whether the series converges.
A. diverges B. converges
Find the function value.sin2 
A. 
B. 2 - 
C. 
D. 
Solve the problem.Matthew has two different stocks. One of the stocks is worth twice as much per share as the other. He has 14 shares of the more valuable stock and 34 shares of the other stock. His total assets in stocks is  How much is the more expensive stock per share?
A. $102 B. $100 C. $96 D. $94
Determine whether or not the relationship shown in the table is a function.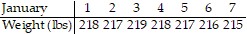 Does the table define the day in January as a function of weight?
A. Yes B. No