Exhibit 3-3 Demand curves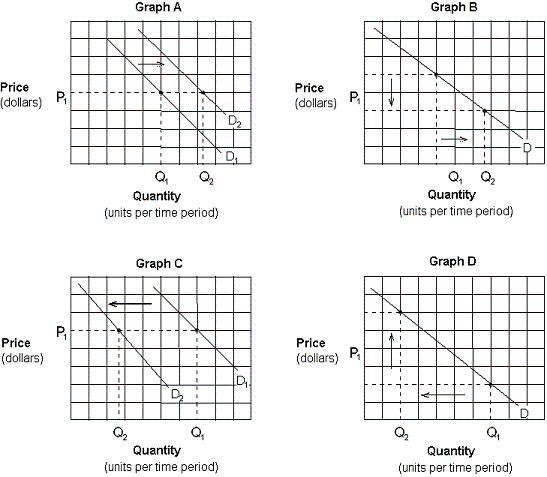
Which of the graphs in Exhibit 3-3 depicts the effect of an increase in income on the demand for pork and beans (an inferior good)?
A. Graph A.
B. Graph B.
C. Graph C.
D. Graph D.
Answer: C
You might also like to view...
In reality, the Fed's information is fairly imprecise in regards to:
A. unemployment B. actual real GDP C. potential GDP D. inflation rates
If the CPI is 120, this means that
A) prices are 120 percent higher than in the reference base period. B) prices are 0.12 times higher than in the reference base period. C) prices are 20 percent higher than in the reference base period. D) the inflation rate must be positive.
An example of a leading variable in the US is
A) GDP. B) investment is structures. C) the consumer price index. D) housing starts.
If a firm hires labor for $4,000, pays rent of $1,500, buys raw materials for $6,000 from another firm, earns profits of $500, and sells its output for $14,000, the value added by the firm is _____
a. $12,000 b. $8,000 c. $6,000 d. $2,000 e. $500