Based on the graph showing the effective federal funds rate, the rates in the early 2000s were ______.
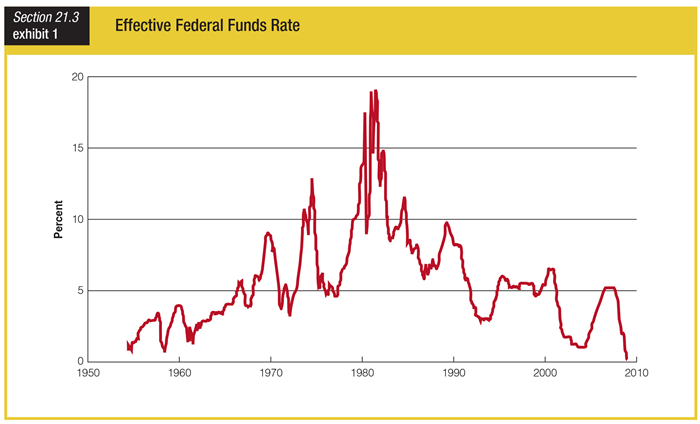
a. the lowest in over 40 years
b. the highest in over 40 years
c. about the average for the past 40 years
d. the only negative rates in over 40 years
a. the lowest in over 40 years
You might also like to view...
An increase in rent will ordinarily lead to
a. an increase in usage of land that was formerly idle. b. a decrease in total land employed. c. less-intensive usage of land. d. a decrease in the income of landlords.
During the debate on the stimulus package in 2009 and 2010, Republicans argued in favor of increased government spending as opposed to tax cuts based in part on the impact government spending would have on aggregate supply
a. True b. False Indicate whether the statement is true or false
Which city currently charges drivers a "congestion toll" to drive into the heart of the city's financial, legal, and entertainment district?
a. Washington, D.C. b. Sydney c. Tokyo d. London
Figure 33-3
?
 Given the situation in graph (1) in Figure 33-3, what can be expected to change in graph (1) when the economy’s self-correcting mechanism operates?
A. Aggregate demand increases. B. Aggregate demand decreases. C. Aggregate supply increases. D. Aggregate supply decreases.