Explain how secondary data analysis is different from the methods we have already examined in this book.
What will be an ideal response?
The research methods we have examined so far in this text have relied on researchers collecting the data or information themselves. Increasingly, however, those interested in criminological research questions are relying on data previously collected by other investigators (Riedel, 2000). As we noted in Chapter 1, this is referred to as secondary data analysis. Secondary data analysis is simply the act of collecting or analyzing data that were originally collected by someone else at another time (Riedel, 2000). Thus, if a researcher goes to a police department and personally compiles information from police reports to examine a research question, she is still engaging in secondary data analysis because the police records were originally collected prior to her own research.
Secondary data analysis is analysis of data collected by someone other than the researcher or the researcher’s assistant.
Secondary data analysis has a long history. Since the latter part of the 17th century, people have been monitoring the state of their localities by examining rates of population, mortality, marriage, disease, climate, and crime. Adolphe Quételet, an ambitious Belgian mathematician, was one of the first to show that the annual number of murders reported in France from 1826 to 1831 was relatively constant and, further, that the proportion of murders committed with guns, swords, knives, stones, kicks and punches, and strangulation was also relatively constant. He concluded that although we may not know who will kill whom by what means, we do know, with a high degree of probability, that a certain number of murders of a certain type will happen every year in France (Menand, 2001). This was one of the first attempts to apply the methods of science to social phenomena. You are also probably familiar with Émile Durkheim’s (1951) use of official statistics on suicide rates in different areas to examine the relationship between religion and suicide.
In this chapter, we will tell you about a number of datasets, including surveys and official records that are publicly available for research purposes. Then we will examine several research methods that rely on secondary data, including cross-cultural research, content analysis, and crime mapping. And finally, because using data originally gathered for other purposes poses unique concerns for a researcher, we will spend the latter part of the chapter highlighting these methodological issues.
In general, there are four major types of secondary data: surveys, official statistics, official records, and other historical documents. Although a dataset can be obtained by an agreement between two or more researchers, many researchers obtain data through the Inter-University Consortium for Political and Social Research (ICPSR) (http://www.icpsr.umich.edu). Data stored at ICPSR primarily include surveys, official records, and official statistics. ICPSR stores data and information for nearly 5,000 sources and studies, including those conducted independently and those conducted by the U.S. government. Riedel (2000) has documented the majority of datasets that are available from ICPSR and that are appropriate for crime research, including the following:
Census enumerations: Historical and contemporary population characteristics. The most well-known datasets within this category are the surveys conducted every decade by the U.S. Census Bureau. Linking information from this dataset (e.g., neighborhood characteristics including such things as poverty and residential mobility) to crime data at the same level (e.g., census block, county) has provided researchers with a rich source of data to test theories of crime.
The National Archive of Criminal Justice Data (NACJD). The Bureau of Justice Statistics and National Institute of Justice cosponsored NACJD, which provides more than 600 criminal justice data collections to the public. A sample of these datasets includes the following:
• Capital Punishment in the United States
• Expenditure and Employment Data for the Criminal Justice System
• Gang Involvement in Rock Cocaine Trafficking in Los Angeles, 1984–1985
• Criminal Careers and Crime Control in Massachusetts
• Longitudinal Research Design, Phase I, 1940–1965
• Changing Patterns of Drug Use and Criminality Among Crack Cocaine Users in New York City: Criminal Histories and CJ Processing, 1983–1984, 1986
• The National Crime Victimization Survey, ongoing
• National Jail Census
• National Judicial Reporting Program
• National Survey of Jails
• Survey of Adults on Probation
• Survey of Inmates of Federal Correctional Facilities
• Survey of Inmates of Local Jails
• Survey of Inmates of State Correctional Facilities
• Federal Bureau of Investigation (FBI) Uniform Crime Reporting (UCR) Program data, including the Supplementary Homicide Reports (SHR)
Social indicators and behavior. There is a series of annual surveys under this heading including the General Social Survey, which has been conducted annually by the National Opinion Research Center since 1972. In addition, Monitoring the Future: A Continuing Study of the Lifestyles and Values of Youth is a survey of a nationally representative sample of high school seniors that asks them for many things, including self-reports of drug and alcohol use and their attitudes toward a number of issues. The National Youth Survey Series (1976–1980 and 1983) is another survey available at ICPSR that examines factors related to delinquency.
Qualitative data sources. Far fewer qualitative datasets are available for secondary analysis, but the number is growing. European countries, particularly England, have been in the forefront of efforts to promote archiving of qualitative data. The United Kingdom’s Economic and Social Research Council established the Qualitative Data Archiving Resource Center at the University of Essex in 1994 (Heaton, 2008). Now part of the Economic and Social Data Service, UK Data Service QualiBank (2014) provides access to data from 888 qualitative research projects. After registering at the UK Data Service site, interview transcripts and other materials from many qualitative studies can be browsed or searched directly online, but access to many studies is restricted to users in the United Kingdom or according to other criteria.
In the United States, the ICPSR collection includes an expanding number of studies containing at least some qualitative data or measures coded from qualitative data (over 500 such studies as of 2014). Studies range from transcriptions of original handwritten and published materials relating to infant and child care from the beginning of the 20th century to World War II (LaRossa, 1995) to transcripts of open-ended interviews with high school students involved in violent incidents (Lockwood, 1996). Harvard University’s Institute for Quantitative Social Science has archived more than 400 studies that contain at least some qualitative data (as of July 2014).
The most unique source of qualitative data available for researchers in the United States is the Human Relations Area Files (HRAF) at Yale University. The HRAF has made anthropological reports available for international cross-cultural research since 1949 and currently contains more than 1,000,000 pages of information on more than 400 different cultural, ethnic, religious, and national groups (Ember & Ember, 2011). If you are interested in cross-cultural research, it is well worth checking out the HRAF and exploring access options (reports can be accessed and searched online by those at affiliated institutions).
The University of Southern Maine’s Center for the Study of Lives (http://usm.maine.edu/olli/national/lifestorycenter/) collects interview transcripts that record the life stories of people of diverse ages and backgrounds. As of July 2014, their collection included transcripts from more than 400 life stories, representing more than 35 different ethnic groups, experiences of historical events ranging from the Great Depression to the Vietnam War, and reports on dealing with problems such as substance abuse. These qualitative data are available directly online without any registration or fee.
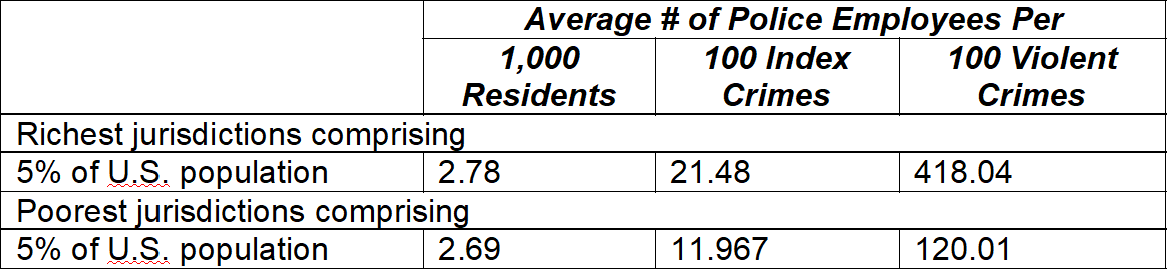
Case Study: Police Protection by Neighborhood -- As you can see, the research possibilities are almost limitless with the wealth of data already made available to researchers interested in issues of criminology and criminal justice. Using UCR data on the number of police officers and civilians employed within specific jurisdictions, David Thacher (2011) recently examined whether the racial/ethnic distribution and its socioeconomic status influenced the degree to which a jurisdiction was protected by these resources. To answer his question, Thacher matched the UCR police data with U.S. Census data. He stated,
With these data on police strength and the composition of the population served by each agency, I am able to describe the distribution of policing by race and class in the same way that the educational literature has analyzed the distribution of educational resources. (Thacher, 2011, p. 283)
To measure poverty, he created a measure called the Concentration Index (CI), which was actually a measure of income inequality. Thacher (2011) found that when police strength was measured as the number of police employees per crime, it varied substantially between rich and poor areas (see Exhibit 9.1 for comparative results). For example, wealthier jurisdictions tended to have significantly more police employees per 100 index crimes compared to poorer areas. This finding runs counter to the contention that cities generally allocate police resources equitably. Thacher (2011) states, “police protection has become more concentrated in the most advantaged communities—those with the highest per-capita incomes and the largest share of white residents” (p. 286). What has changed, Thacher believes, is the crime rates. For example, when police protection per capita (number of individuals in jurisdiction) is examined, police protection has not changed much since 1970 across jurisdictions. However, because crime became more concentrated in the poorest communities during that time, police resources per crime have become less egalitarian. What does this mean in the real world?
The result is a growing workload disparity between rich and poor jurisdictions. In rich jurisdictions, each police officer has responsibility for fewer and fewer crimes over time, while in poor jurisdictions this part of the police workload has either remained constant or grown. (Thacher, 2011)
You might also like to view...
In Dewell v. Lawson, the chief of police was held liable for failing to establish procedures for the diagnosis and treatment of ______
Fill in the blank(s) with correct word
Answer the following statement(s) true (T) or false (F)
1. Prisoners are regarded as a vulnerable population for research study purposes. 2. How the media report specific incidents can affect public perceptions of prison or community supervision programs. 3. The costs associated with the elderly inmate are exponentially higher than those associated with the average inmate. 4. Offender populations are likely to become much less complicated in the future.
Include the following information about previous employment experience on your resume with the exception of ______.
a. job position or title b. employer’s phone number c. duties and responsibilities d. employer’s name and location
The Senate candidate from the party you represent has asked you to make a speech at his campaign event, since you share his ideas. You wish to show your support and also make your positions known. Which of the following is true?
a. You are free to appear and speak however you wish. b. Since you are currently a judge, you are not permitted to make political speeches. c. You may make a speech but it cannot be broadcast. d. You can make a speech to support your friend but you must avoid any topics that might relate to matters covered by your court.