This double-bar graph shows the number of male (M) and female (F) athletes at a university over a four-year period. Answer the question.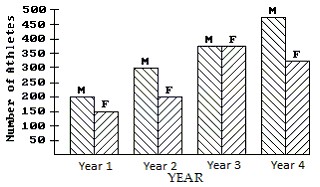 What is the only year in which the number of female athletes declined from its previous value?
A. Year 1
B. Year 2
C. Year 4
D. Year 3
Answer: C
Mathematics
You might also like to view...
Divide.
A. -15 B. 6 C. -6 D. 15
Mathematics
Find the probability.A bag contains 19 balls numbered 1 through 19. What is the probability of selecting a ball that has an even number?
A. 9
B. 
C. 
D. 
Mathematics
Evaluate. +
+  + . . . +
A. 254 B. 128 C. 255 D. 256
Mathematics
Provide an appropriate response.At what nominal rate of interest, compounded quarterly, will an investment double in 15 years?
Fill in the blank(s) with the appropriate word(s).
Mathematics