Refer to the graph shown. The shift from SATC1 to SATC2 reflects: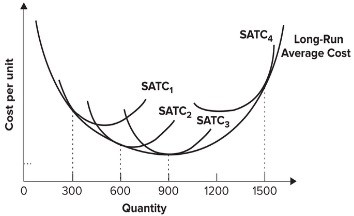
A. diseconomies of scale.
B. increasing marginal productivity.
C. diminishing marginal productivity.
D. economies of scale.
Answer: D
You might also like to view...
The above figure shows the Lorenz curves for four different countries. In which country is income most equally distributed?
A) country A B) country B C) country C D) country D
Relative to the short-run demand for gasoline, the long-run demand for gasoline is
A) probably more elastic since people need time to change automobiles and driving habits. B) probably less elastic since people need time to change automobiles and driving habits. C) probably more elastic because people can hoard this good. D) probably less elastic because people cannot store this good.
When the wages paid to government economists increase, the labor supply curve for academic economists
a. shifts to the left. b. shifts to the right. c. will become backward-sloping. d. will not change.
What percentage of American families pay more payroll tax than they pay in income tax?
A. 40. B. 60. C. 75. D. 80.