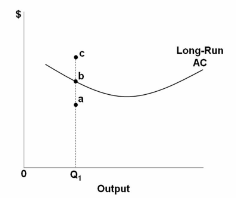
Refer to the diagram. If a firm produces output Q 1 at a unit cost of c, then the:
A. firm is operating in a purely competitive industry.
B. firm is maximizing profits.
C. marginal product per dollar's worth of each resource employed is not the same.
D. firm is fulfilling the least-cost rule in employing resources.
C. marginal product per dollar's worth of each resource employed is not the same.
You might also like to view...
According to the paradox of value, expensive goods, such as gemstones, provide consumers with
A) high total utility and low marginal utility. B) low total utility and low marginal utility. C) low total utility and high marginal utility. D) high marginal utility and high total utility.
A common explanation for the behavior of the short-run U.S. Phillips curve in 2009 and 2010 is that, over the previous 20 or so years, the Federal Reserve had
a. established a lot of credibility in its commitment to keep inflation at about 2 percent. b. established a lot of credibility in its commitment to keep inflation at about 5 percent. c. failed to establish significant credibility in its announced intent to keep inflation at about 2 percent. d. failed to establish significant credibility in its announced intent to keep inflation at about 5 percent.
The total fixed cost curve:
A. varies with the quantity of inputs used. B. decreases with output. C. increases with output. D. remains constant regardless of output.
PriceQuantity Demanded$4300$3400$2500$1600Refer to the above data. What is the elasticity of demand between the prices of $3 and $2?
A. 0.22 B. 0.56 C. 1.22 D. 0.40