The two major curves or lines in the TE-TP diagram are:
A) the total expenditure curve and the 45-degree line.
B) the supply and demand curves.
C) the total expenditures and national income curves.
D) the total production and national income curves.
A
You might also like to view...
The total sum of squares is 400 and the sum of squares errors is 100, what is the coefficient of determination?
A) 25 B) 0.75 C) 1.00 D) 0
John paints the exterior of his house and, as a result, his neighbor Christine is able to sell her home for $5,000 more than she could have before. John's house painting
a. creates a negative externality for Christine b. makes John a free rider c. results in an efficient market outcome for both parties since both benefit d. creates a positive externality for Christine e. was poorly done
Refer to the accompanying graph. If this firm is a price taker and the price of each unit of output is $9, then this firm should: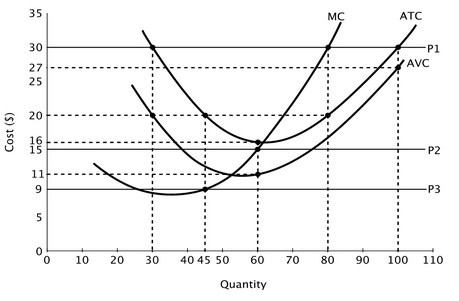
A. produce 45 units of output. B. raise its price to increase its revenue. C. lower its output to decrease its marginal cost. D. shut down in the short run.
The best explanation for ________ is a fixed factor causes diminishing returns to other factors.
A. the shape of a short-run marginal cost schedule B. a horizontal marginal revenue curve C. increasing returns to scale D. a perfectly competitive firm earning economic profits in the long run