The following comparison line graph indicates the number of vehicles sold for a seven week period by two different salespeople. Use the graph to answer the question.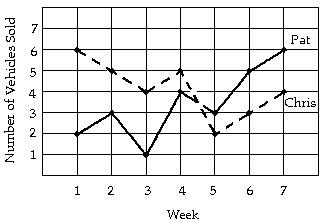 During what week did Chris sell the most number of vehicles?
A. Week 5
B. Week 3
C. Week 7
D. Week 1
Answer: D
Mathematics
You might also like to view...
Multiply and simplify. ?
? 
A. - 
B. 
C. 
D. -12
Mathematics
Find the average value of the function f over the given region.f(x, y) = 7x + 9y over the region bounded by the coordinate axes and the lines  and
and  .
.
A. 
B. 52
C. 26
D. 39
Mathematics
Evaluate the expression.0.868 + 4.19 ÷ 0.05
A. 101.16 B. 9.248 C. 84.668 D. 92.48
Mathematics
Use the given information to find the exact value of the trigonometric expression.sin ? = -  ;
;  < ? < 2?
 Find tan(2?).
A. - 
B. 
C. 
D. - 
Mathematics