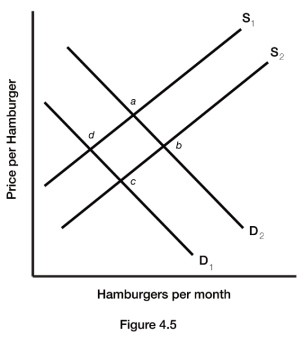
 Figure 4.5 illustrates a set of supply and demand curves for hamburgers. A decrease in demand and a decrease in quantity supplied are represented by a movement from:
A. point c to point a.
B. point a to point c.
C. point b to point c.
D. point d to point b.
Answer: C
You might also like to view...
The above table gives data on two variables. If these data were graphed, their relationship would
A) be a straight line. B) be a curved line. C) show a negative relationship. D) nonexistent.
Which of the following is most likely to result in unemployment?
a. Aggregate demand grows more rapidly than aggregate supply. b. Aggregate demand and aggregate supply grow at the same rate. c. Aggregate supply grows more rapidly than aggregate demand. d. Neither aggregate demand nor aggregate supply grows at all.
If the MPP of a worker is 12 units per hour and the wage rate is $10 per hour, the unit labor cost is equal to $1.20 per unit of output.
Answer the following statement true (T) or false (F)
Expenditure switching policies are best used on their own
Indicate whether the statement is true or false