The line graph shows the recorded hourly temperatures in degrees Fahrenheit at an airport.  During which hour did the temperature increase the most?
A. 9 a.m. to 10 a.m.
B. 12 p.m. to 1 p.m.
C. 10 a.m. to 11 a.m.
D. 1 p.m. to 2 p.m.
Answer: C
Mathematics
You might also like to view...
Given that the polynomial function has the given zero, find the other zeros.f(x) = x4 - 36; 
A.  i
i
B. -6i, 6i, -
C. - i,
i,  i, -
i, -
D. -
Mathematics
Write as a percent.
A. 60% B. 6% C. 600% D. 0.6%
Mathematics
Graph the hyperbola. -
-  = 1
= 1
A. 
B. 
C. 
D. 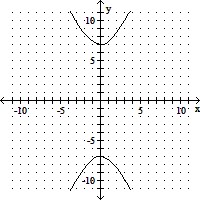
Mathematics
Solve the equation by factoring.12x2 - 5x - 25 = 0
A. {-  ,
,  }
}
B. {-  , -
, -  }
}
C. { ,
,  }
}
D. { , -
, -  }
}
Mathematics