Explain how to obtain the graph of the given quadratic function from the graph of  f(x) = -4(x - 5)2 + 8
A. Take the graph of y = x2 and shift it 5 units to the left, shift it 8 units up, vertically stretch it by a factor of +4, and the graph will open downward.
B. Take the graph of y = x2 and shift it 5 units to the right, shift it 8 units up, vertically compress it by a factor of +4, and the graph will open downward.
C. Take the graph of y = x2 and shift it 5 units to the right, shift it 8 units up, vertically stretch it by a factor of +4, and the graph will open downward.
D. Take the graph of y = x2 and shift it 5 units to the left, shift it 5 units down, vertically stretch it by a factor of +4, and the graph will open upward.
Answer: C
You might also like to view...
Graph the function. Determine the symmetry, if any, of the function.y = -|x|
A. Symmetric about the origin
B. Symmetric about the y-axis
C. Symmetric about the x-axis
D. Symmetric about the y-axis
Find the x- and y-intercepts for the equation. Then graph the equation.y = 5x
A. x-intercept: (0, 0), y-intercept: (0, 0)
B. x-intercept: (0, 0), y-intercept: (0, 0)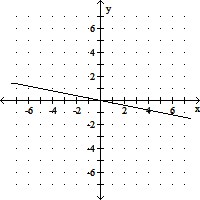
C. x-intercept: (0, 0), y-intercept: (0, 0)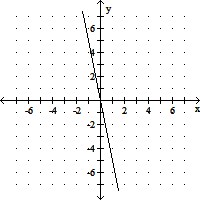
D. x-intercept: (0, 0), y-intercept: (0, 0)
As part of a study on the metabolism of athletes, 400 college basketball players are randomly chosen and their weights taken. The distribution of the weights is approximately normal. The average weight is 215 pounds and the standard deviation is 15 pounds.Approximately how many players had weights with standardized values between 1 and 2?
A. 108 B. 216 C. 54 D. 200 E. none of these
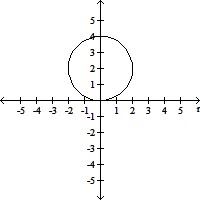
Sketch the graph of the polar equation. Identify the curve.r = 4 sin(2?)
A. lemniscate
B. rose curve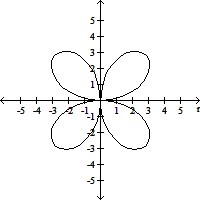
C. rose curve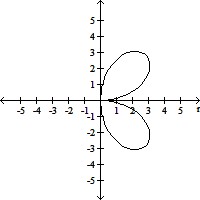
D. circle