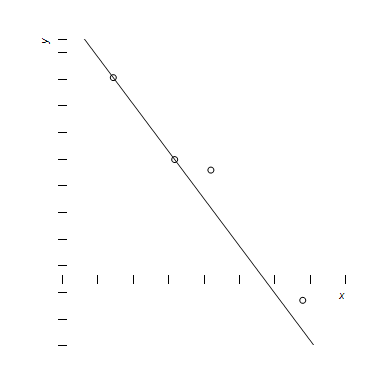
Plot the graph of the data along with the regression line for the following table of values.
x1.443.174.19 6.78 y15.128.98 8.19-1.57
What will be an ideal response?
?
You might also like to view...
Find the future value of the given annuity. Round to the nearest cent.$4000 is invested annually for 11 years at 4.8% compounded annually
A. $55,236.92 B. $57,236.92 C. $55,736.92 D. $56,236.92
Solve the formula for the specified variable.I =  for n
for n
A. n = 
B. n = IR(Ir - E)
C. n = 
D. n = 
Use Descartes' Rule of Signs to determine the possible number of positive and negative real zeros for the function. Then, use a graph to determine the actual number of positive and negative real zeros.P(x) = -6x4 - 6x3 - 4x2 - 5x + 7
A. possible: 0 or 2 pos, 0 or 2 neg
actual: 2 pos, 0 neg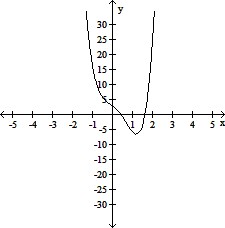
B. possible: 1 pos, 1 or 3 neg
actual: 1 pos, 1 neg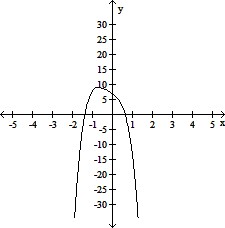
C. possible: 1 pos, 1 neg
actual: 1 pos, 1 neg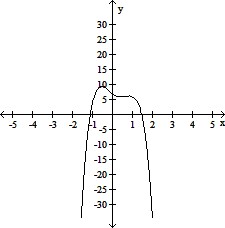
D. possible: 1 pos, 1 or 3 neg
actual: 1 pos, 1 neg
Does the system have one solution, no solution, or an infinite number of solutions?3x = y + 36x - 2y = 3
A. One B. No Solution C. Infinite number